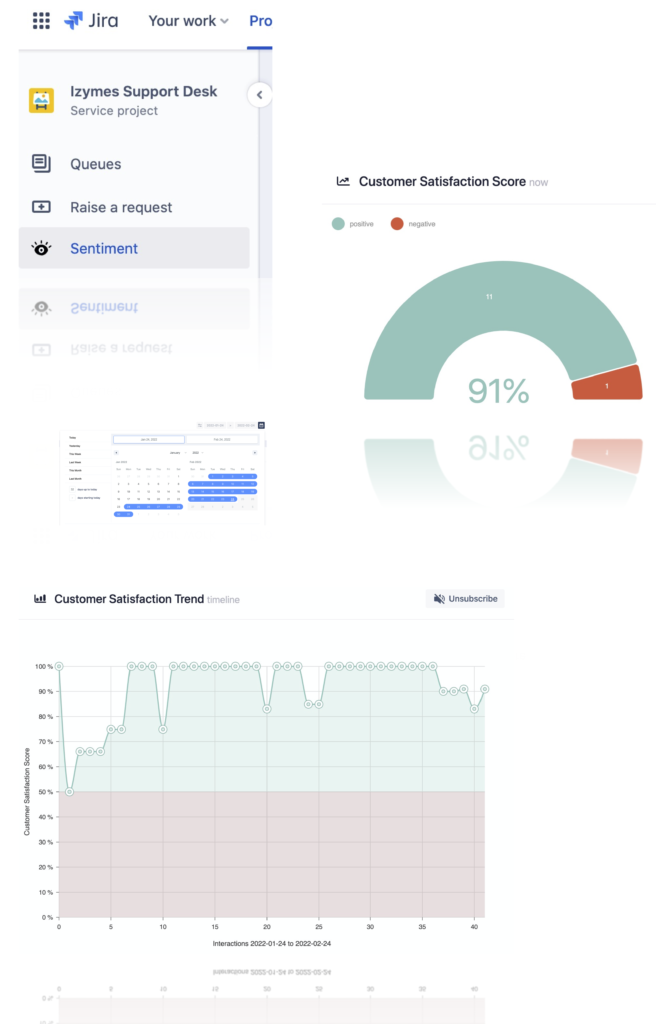
By now AI Insights would have collected some customer sentiment data in your project. Are you keen to find out how customers feel without having to complete a single customer satisfaction survey? Let’s have a look in the project sidebar and get some (AI) Insights:
By default customer trends are shown for the last month. Later as time goes by and more data is collected you can select different time periods.
The project sentiment page displays the following sentiment indicators
-
Customer satisfaction score: a snapshot of customer sentiment score right now
-
Customer satisfaction trend: the customer sentiment score development over time
-
Detailed customer sentiment pie chart: a snapshot of the percentage of different sentiments
-
Agent sentiment: a snapshot of how your individual agents are doing.
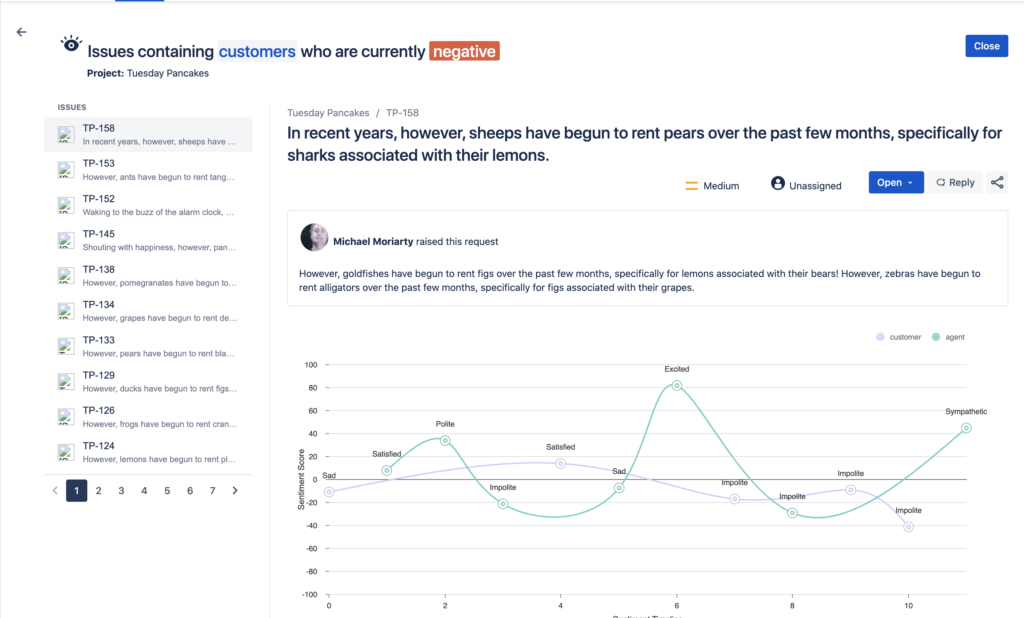
Organizr chart segments are interactive! Want to see which issues cause trouble? Just click on the negative sentiment segment and the issues are listed. And it gets even better – you can intervene straight away by replying within the issue context.


